Computer Graphics

Recent news about GRAVITY
Research Areas
Research Publications
Graphics, Visualization and Image Processing Courses offered by GRAVITY faculty
GRAVITY Contact Information and Site Maps
Research and Job Opportunities
Research Team
Research Sponsors and Collaborators

Research Profile

Joerg Meyer

Joerg Meyer, Ph.D.

Display Exploration Engineer

Apple, Inc.


Email: joerg.meyer01@gmail.com


Research Interests

Dr. Meyer's research interests include scientific visualization, large-scale rendering, high-performance computing, 2-D and 3-D computer graphics, multi-resolution techniques, interactive rendering, and virtual reality. His research efforts are aimed at developing novel visualization algorithms, using state-of-the-art visual analytics techniques and providing parallel supercomputing support to researchers from various disciplines to help them understand their experimental and simulation data. He has developed interactive rendering methods for large, time-varying scientific data sets using wavelet transformation, space-subdivision and hardware acceleration methods. Dr. Meyer's research is focused on scientific visualization with applications in Geology (environmental clean-up), Civil Engineering (ground motion and structural response simulations for earthquake visualizations, disaster mitigation), and Biomedical Imaging (large-scale, interactive 3D volume rendering of CT/MRI data, image enhancement and segmentation). The common theme for all these interdisciplinary domains is the occurrence of tera- to exa-byte data sets and the need for real-time, interactive rendering and visual data analysis.

Biography

Dr. Meyer is a Display Exploration Engineer at Apple, Inc. His work is focused on developing hardware and software systems for novel display architectures. He also worked at Magic Leap, Inc., as Principal Systems Engineer on validating and calibrating multi-sensor display systems for augmented and mixed reality. Prior to these appointments he held a position as a Computer Systems Engineer in the Computational Research Division at Lawrence Berkeley National Laboratory. As a member of the Visualization Group, his research was focused on large-scale, parallel scientific data visualization and high-performance computing support for visualization applications. Dr. Meyer was also a member of the Analytics Group at the National Energy Research Scientific Computing Center (NERSC) and a member of the Remote Data Analysis and Visualization (RDAV) support staff of the National Institute for Computational Sciences (NICS) at Oak Ridge National Laboratory (ORNL). Previously, Dr. Meyer held a faculty position in the Department of Electrical Engineering & Computer Science and in the Department of Biomedical Engineering at the University of California, Irvine, where he conducted his research on high-performance computing and visualization techniques at the California Institute for Telecommunications and Information Technology (Calit2) since 2002. He received his Ph.D. from the University of Kaiserslautern, Germany, in 1999. He held an appointment as a post-doctoral researcher and lecturer in the Computer Science Department at the University of California, Davis, from 1999 to 2000, and maintains an Adjunct Assistant Professorship at the Computer Science and Engineering Department at Mississippi State University, where he was also affiliated with an National Science Foundation Engineering Research Center (2000-2002). Dr. Meyer has led and served on various conference and program committees for multiple professional organizations, including IEEE, ACM SIGGRAPH and EuroVis. He has published over 152 journal articles, book chapters, conference papers, abstracts and posters in his research field.

Features

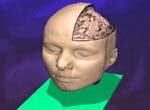
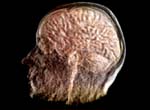
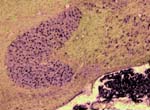
Biomedical Imaging  Visualization of large-scale data sets requires advanced techniques in image processing, hierarchical data management, data reduction and rendering. Hierarchical, octree-based space subdivision techniques, wavelet-based volume data compression, progressive data transmission, multi-level-of-detail rendering and 3-D texture-based, hardware-accelerated visualization methods are the enabling technologies for interactive rendering on multiple scales. This project addresses the issue of developing interactive rendering methods for data sets, which are too large to fit on a local harddrive. Output devices range from desktop PCs to large-scale, immersive displays for stereoscopic viewing. <More>


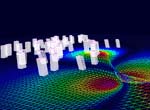
Earthquake Simulation  Researchers at UC Irvine, UC Berkeley, Carnegie Mellon University, and Mississippi State University advance the state-of-the-art in simulating the effects of a major earthquake on an urban region by integrating ground motion modeling with modeling of structural and infrastructure systems. Using advanced computational and visualization methods, a distributed interactive simulation framework is created to facilitate investigation of the performance of urban regions in a major earthquake. <More>


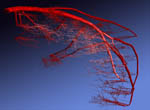
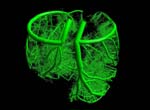
Cardiovascular System  Cardiovascular diseases, such as atherosclerosis and coronary artery disease, are high risk factors for cardiac pain and death. Huan T. Nguyen, a Ph.D. student in the Biomedical Engineering Department at UC Irvine, and Dr. Thomas Wischgoll, a post-doctoral fellow and visiting researcher, have developed a visualization software that enables interactive 3-D volume visualization of the cardiac vessel tree, and an interactive flight through the vessel. Bifurcation angles and radii of the vessels can be measured while exploring the tree. Areas of high risk that could cause potential problems can be identified by this method. The project is conducted in collaboration with Dr. Ghassan Kassab's lab in the Department of Biomedical Engineering, who provided the data set, and whose goal is to develop a compuational model of the coronary vessel system of the human heart. <More>


Biomolecular Visualization  Biomolecular databases have grown exponentially in the past two decades as more and more information about molecules and genomes is being collected. Large molecules often consist of thousands of atoms, and it is impossible to generate comprehensive displays of the detail structure by using conventional methods. A detail view is essential for comparison of related molecules. Virtual reality methods are employed to enable a large field of view, and to allow the observer to interact with the structures on a molecular level. The user is immersed in a virtual environment that allows him or her to closely inspect a molecule from the inside, to grab a molecule and superimpose it to another one for comparison, and to reveal structures that are potentially hidden or not visible in a standard textbook representation. Many times new structures are discoverd just by looking at the object from a different angle or viewpoint. <More>


Hyper-Streamlines  The analysis and visualization of tensor fields is an advancing area in scientific visualization. Topology based methods that investigate the eigenvector fields of second order tensor fields have gained increasing interest in recent years. To complete the topological analysis, Dr. Thomas Wischgoll developed an algorithm for detecting closed hyper-streamlines as an important topological feature. <More>


Low-cost Volume Rendering  Volumetric rendering and research was traditionally done on high-end professional graphic workstations. Recent advances in general consumer hardware, particularly in the consumer graphics industry, has allowed researchers and developers to explore a new lower cost solution for volumetric rendering. The goal of this project by Kenny Kwan is to investigate volumetric rendering on current day PCs and consumer level graphics hardware. <More>


Interactive Visualization  Visualization of large medical data sets requires advanced techniques in image processing and data reduction. InVIS is an interactive rendering system for visualization of compound data sets, comprising volumetric and geometric data. The core of the InVIS system is a time-controlled rendering pipeline, which accepts biological and medical data sets derived from CT or MRI scanners and confocal laser scanning microscopes, as well as artificial, geometric data from CAD systems. A flexible import module allows for easy adaptation to new data types. The system can be customized to provide different user-specific views of the data, including 2D/3D preview tools, surface reconstruction, and volume raycasting. In contrast to other systems, a fixed frame rate is maintained throughout the pipeline in order to ensure immediate response to the user's action. Interactive behavior is an essential feature of the system, because it enables the user to manipulate and adjust the visualization on demand. <More>


Artistic Effects  In media and arts, digital image processing and electronic filtering of images are ubiquitous. Heuristic methods coupled with physics-based computations can create fascinating simulations of light and color distribution. Emerging from a class project (EECS209A) on rendering techniques, various filters have been implemented, ranging from ray refraction according to Snell's law to water color and oil paintings. <More>


© 2014 Joerg Meyer